Map interaction and zoom levels
Under Notes
An important feature of incendios.pt are the administrative area pages with detailed statistics on fires in that region. To allow users to easily switch between them and compare statistics between regions, we allow click events on the map to browse the site. Every time a user clicks on a specific administrative area type, like District, Municipality, or Parish, its page is shown. This improves the speed of the exploration since the users don’t need to drill down using the hierarchical selectors.
The visibility of the different types of administrative areas changes according to the zoom level. Up to zoom level 9 the Districts are visible, from 10 to 12 the Municipalities are visible and from 13 onwards Parishes can be viewed. The click behaviour we implemented follows the same logic.
Even though Tilemill allows to set a location when a user clicks on a point, polygon or line, it does not allow to differentiate based on zoom level. This note explains briefly how we built a different link based on zoom level of the maps.
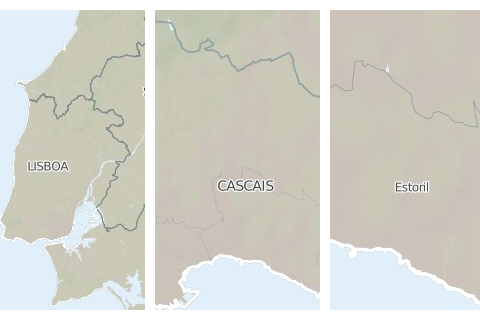
###Structure of links Every area in Portugal has a unique id which in our project is called AAID. This is a number which can have 2, 4 or 6 digits, depending on the level of the area.
| District | Municipality | Parish |
|---|---|---|
| Lisboa | Cascais | Estoril |
| 11 | 05 | 04 |
The id for Lisboa is 11
The id for Cascais is 1105
The id for Estoril is 110504
The links of the pages of incendios.pt are structured using the same id. In the case of our example: http://incendios.pt/en/por/110504.
###Setting up the interactivity To add the links to the map, we use a layer containing the polygons of all the parishes, with the AAID as one of the attributes. This layer is completely transparent, since we only use it to implement the navigation.
Tilemill exports this layer to the mbtiles format (set of png’s) and uses the clever UTFGrid to allow interactivity with certain points or areas of a map. Through the use of some javascript we are able to bind events to this layer and handle the click to perform a redirection to the correct page.
// Include the map.
var map = L.mapbox.map('map', 'flipside.map-epnw0q4t', {minZoom: 7, maxZoom: 14}).setView([40, -7.5], 6);
The map click will always fire on the Parishes because they are the most detailed element in the District > Municipality > Parish stack. When the click event occurs, Mapbox provides all the attributes of the parish that were included in the original layer in Tilemill, including the AAID. This allows us to generate the proper ID based on the zoom level.
// *** Layer. Grid of administrative borders. Used for interactivity.
var grid_layer = L.mapbox.gridLayer('flipside.pt-admin-areas');

// Setup the interactivity.
// When the user clicks...
grid_layer.on('click', function(data){
  if (typeof data.data == 'undefined') {
    //Nothing to do here!
    return;
  }

  // The data.data object contains all the data about the clicked region.
  // The data.data.AAID is the id of our clicked freguesia.
  // Now, based on the zoom level we extract the portion of the aaid that interests us.
  if (map.getZoom() <= 9) {
    // Distrito.
    // Ex: Full id: 110506
    var destination = data.data.AAID.substring(0,2);
    // Ex: destination = 11
  }
  else if (map.getZoom() >= 10 && map.getZoom() <= 12) {
    // Concelho.
    // Ex: Full id: 110506
    var destination = data.data.AAID.substring(0,4);
    // Ex: destination = 1105
  }
  else {
    // Freguesia.
    // Ex: Full id: 110506
    var destination = data.data.AAID;
    // Ex: destination = 110506
  }

  // Take the language into account by using Incendios.page_meta.lang
  window.location.href = '/' + Incendios.page_meta.lang + '/por/' + destination;
});

// Add layer to map.
map.addLayer(grid_layer);
For incendios.pt we only needed something simple, but you could apply the same approach to build things like custom legends and popups.