Clean energy investment in emerging markets
Under Notes
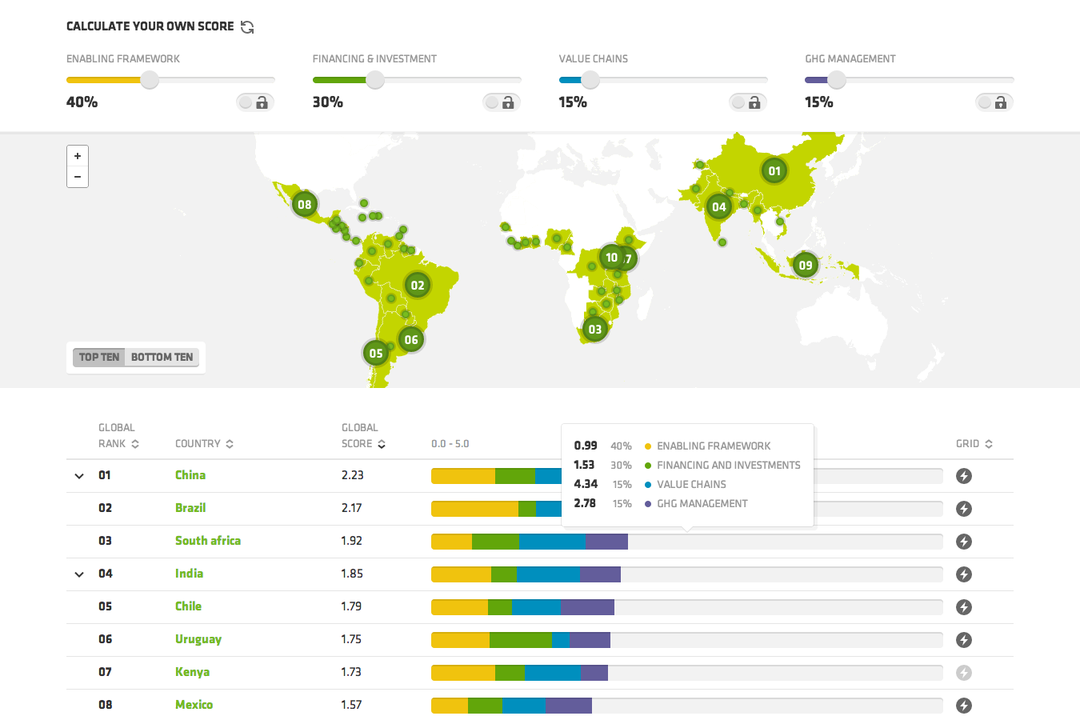
The clean energy sector in emerging markets shows great potential to attract investment. Information is key to make good decisions and investors need quality data on issues like a country’s legal framework, the availability of financing opportunities, or the presence of local value chains. The Climatescope 2014 - launched today - is both a report and tool that provides investors, entrepreneurs and policy makers with information that guides them in their decision making process.
Originally published by the Multilateral Investment Fund and Bloomberg New Energy Finance, the Climatescope started in 2012 by examining 26 countries in Latin America and the Caribbean. For the 2014 edition, they joined forces with DfID and USAID to expand the scope and include another 29 countries from Asia and Africa.
In collaboration with Development Seed, we worked with these organizations to turn the Climatescope into an actionable tool to explore the data and get a comprehensive view on the performance of 55 countries around the globe. The result allows people to go quickly from high-level and customizable rankings, to in-depth insights on country and state level.
Static site and API
Given the nature of the Climatescope data and our experience in previous projects, we decided on a simple tech stack that allowed us to focus on design and on structuring the data clearly. The result is a static site and API that still allows the user to dynamically explore and download the data. Built with Jekyll and Angular and hosted on Github, that is easy to maintain and highly performant.
The underlying core data that powers the visualizations, can be re-generated using a series of Python scripts. These scripts produce the JSON files for the API and the CSV files that are available for download. This allows the Climatescope team to independently update the data, or add data about new countries or years.
Open
To consolidate the Climatescope’s position as a global reference, the raw data has been made available under an open license. This will make it easier for others to use the data in their projects and decision making processes. Every page that contains data, has a download button that provides a CSV file with the data that is being viewed at that moment. The full dataset is available as well, should people be interested in doing their own analysis. The same open principle also applies to the rest of the project. The website’s source code is for example available on Github under the open source GPLv3 license.
Future
We are excited to continue our work on the Climatescope and publish additional features over the next couple of months. If you have suggestions or encounter any technical issue, feel free to file an issue at the project’s Github repository, or drop us a line.